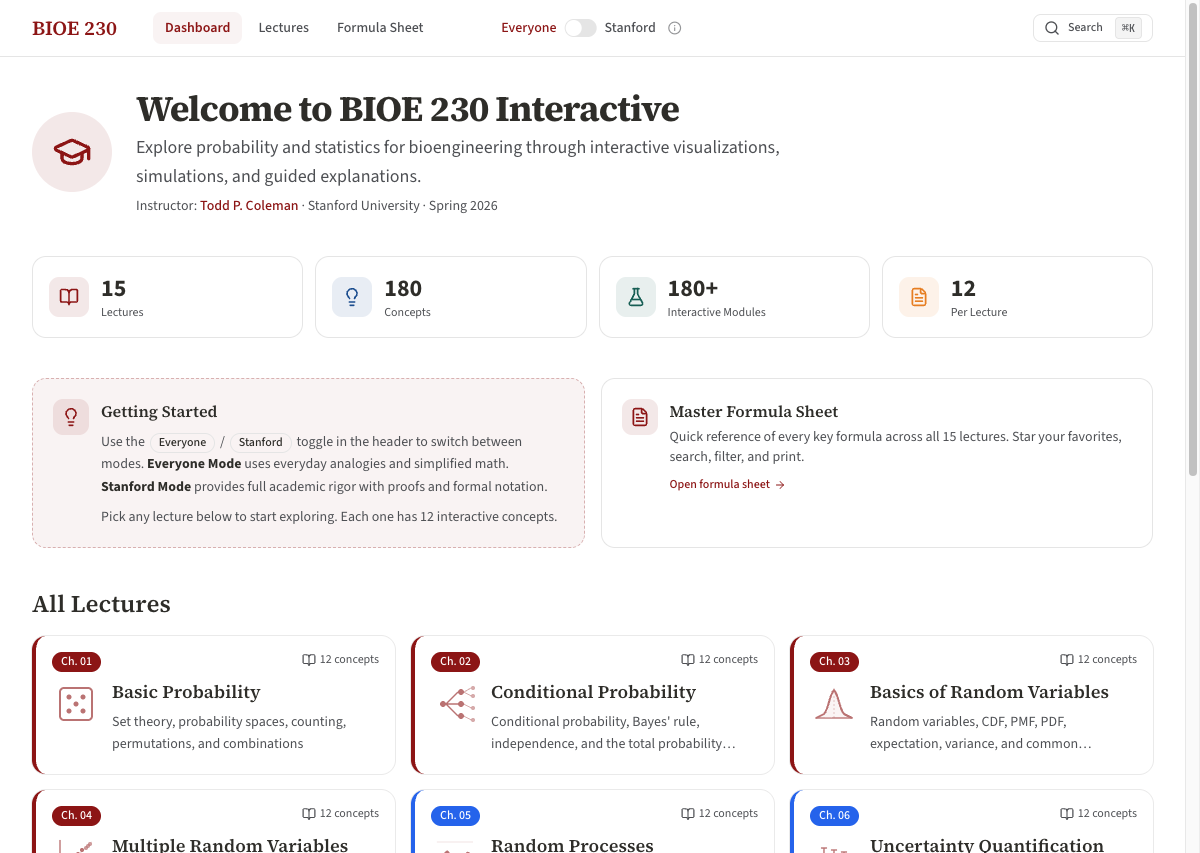
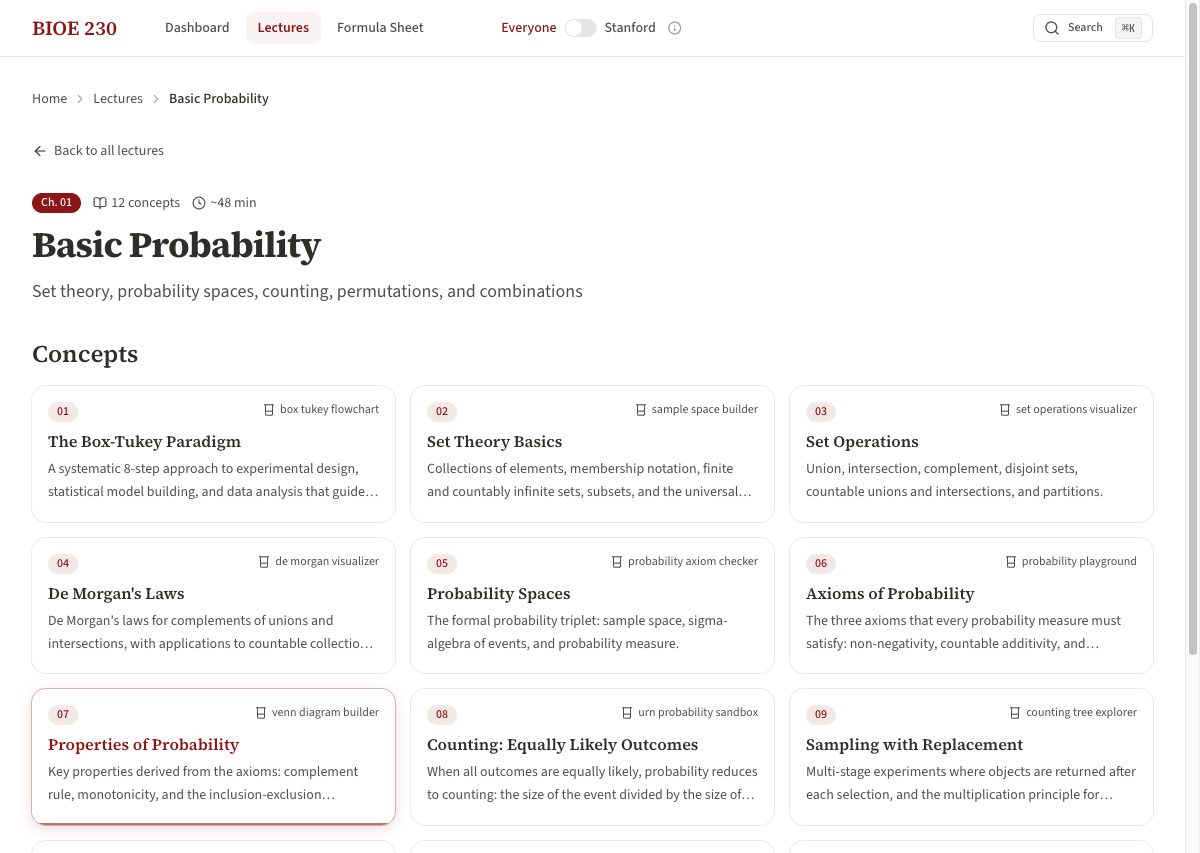
An interactive learning platform for probability and statistics. Professor Todd P. Coleman uses it to teach 200+ students at Stanford.
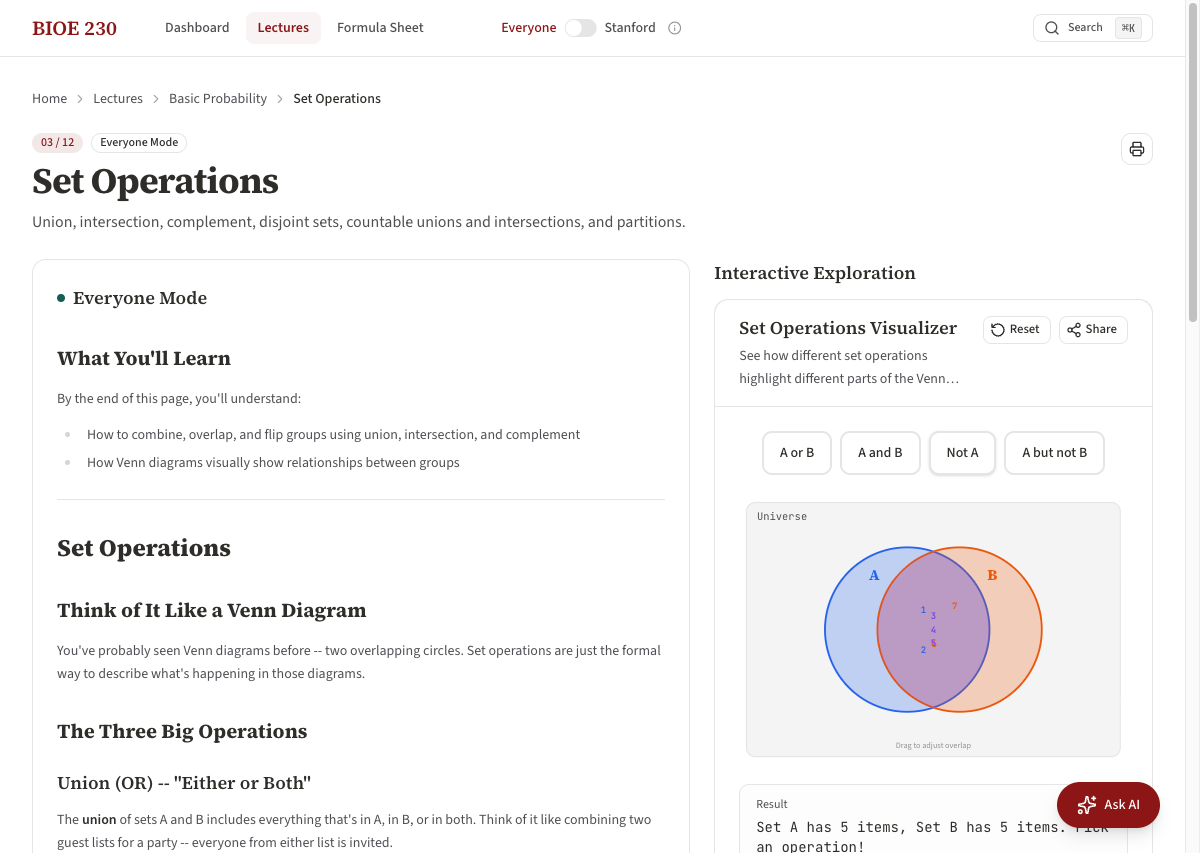
A professor hands you 15 dense lecture PDFs on probability and statistics for bioengineering. The material is rigorous -- proofs, theorems, formal notation. Students can read it, but they can't feel it. They can't drag a Venn diagram and watch the probability change. They can't adjust the mean of a bell curve and see the distribution shift. They can't click to place data points and watch a regression line snap into place.
The challenge wasn't building one visualization. It was building a system that transforms any lecture into an interactive experience -- 180 of them, each with its own novel module, all organized into a platform that a professor can control and students can use every day.
I built an interactive platform where every concept in the course has its own novel visualization. Students toggle between "Everyone" mode (plain-language explanations) and "Stanford" mode (full academic rigor with proofs). A contextual tutor answers questions as students learn. A spaced-repetition system tracks what they've mastered.
The platform has 180 interactive modules. Here are five that show the range.
Simulate how EEG electrodes capture brain signals and use PCA to decode motor intent from noisy neural data.
SimulationLoad a gene expression dataset, run principal component analysis, and discover which genes drive the most variance.
ExplorerSet sample size, effect size, and significance level. Watch statistical power change. Design a trial that would actually get funded.
BuilderPaint decision boundaries on a 2D scatter plot. See accuracy, precision, and recall update with every brush stroke.
GameA patient tests positive. What are the real odds they're sick? Experience the false positive paradox -- the most counterintuitive result in statistics.
GameThese are simplified versions of modules from the real platform. The live version has 180 of them.
One toggle switches the entire platform between accessible explanations and full academic rigor with proofs.
Built-in tutor that knows exactly which concept the student is viewing. Answers at the appropriate difficulty level.
Every concept has a novel interactive module. Not animations -- actual tools students manipulate.
Categorized by difficulty with spaced repetition tracking.
Works offline on any device. Students use it during lectures.
Admin panel for content editing, lecture visibility, and analytics.
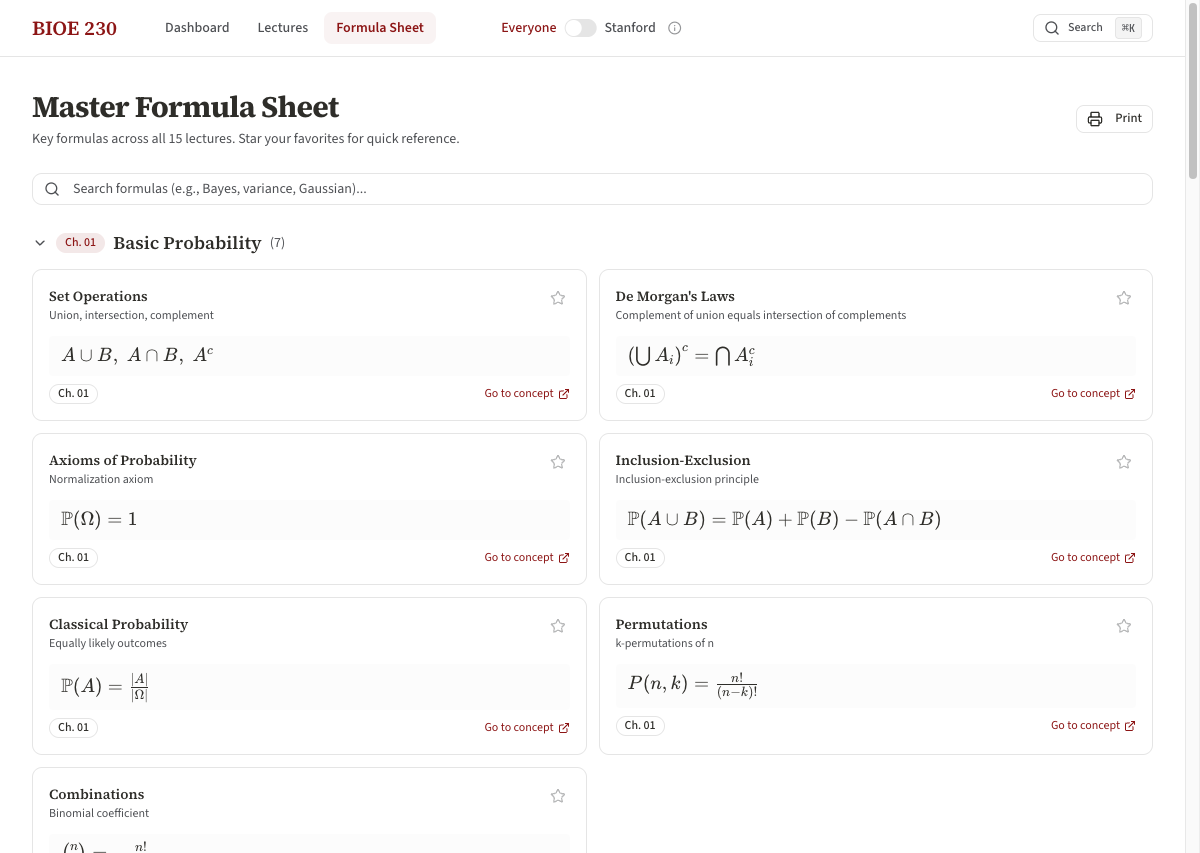
Searchable LaTeX formula sheet across all 15 lectures.
Production TypeScript. 850 files. 116 automated tests. Zero errors.
Each concept page has a unique D3.js-powered visualization -- from Venn diagrams to 3D Gaussian surfaces to brain-computer interface simulations. Loading 180 heavy components upfront would make the app unusable. Solution: dynamic imports with next/dynamic and a module registry that loads each visualization only when the student navigates to that concept. The registry maps concept slugs to lazy-loaded components, keeping initial bundle size under 200KB.
Every concept page has two versions: "Everyone" mode with plain-language analogies and simplified math, and "Stanford" mode with formal proofs and academic notation. Both must render from the same MDX source file -- not two separate files that could drift out of sync. Solution: conditional rendering blocks in MDX with a mode-aware provider. The toggle switches instantly because both modes are pre-rendered; only the visible blocks change.
The professor needed students to actually want to use it. That meant PWA support for offline access during lectures, spaced repetition for practice problems, a searchable formula sheet with LaTeX rendering, keyboard shortcuts for power users, and an admin panel so the professor could control exactly which lectures were visible each week. Every feature had to work on mobile -- students use phones during class.
Built with: Claude Code + Vercel AI SDK + Gemini — read more about my AI engineering stack →
Professor Todd P. Coleman adopted the platform for BIOE 230 (Probability and Statistics for Bioengineering) in Spring 2026. Students use it during lectures to follow along with interactive visualizations, for homework to practice with 960 problems, and for exam preparation with the searchable formula sheet.
A background in molecular biology and neuroscience research informed the platform's approach to scientific content - understanding how students actually process dense quantitative material. The system was designed from the start to be flexible -- it can accommodate any lecture-based course, not just probability and statistics.
I'm exploring leadership roles where building the technology and running the business aren't treated as separate jobs.